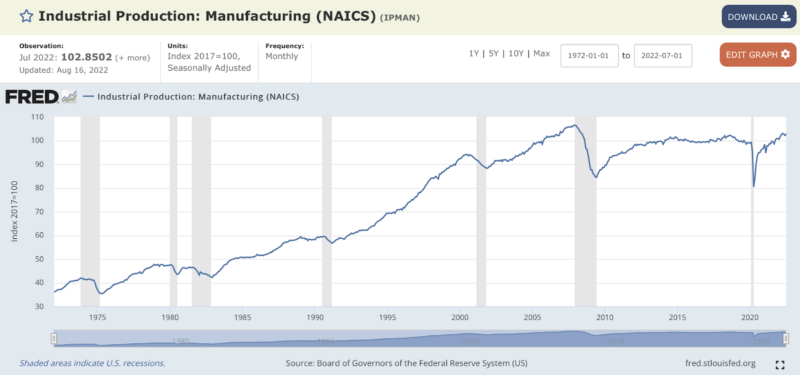
Another popular myth is that American manufacturing output has been long declining. The graph below – reproduced from the St. Louis Fed’s FRED data site[3] – busts that myth. American manufacturing output hit an all-time high on the eve of the Great Recession. After falling during that recession, it then grew a bit before leveling off for about eight years. Manufacturing output fell again during the first throes of COVID hysteria, but has, since April 2020, chugged upward. In July 2022 this output was only three percent lower than its all-time high in December 2007, and was 21 percent higher than its Great-Recession low in June 2009.
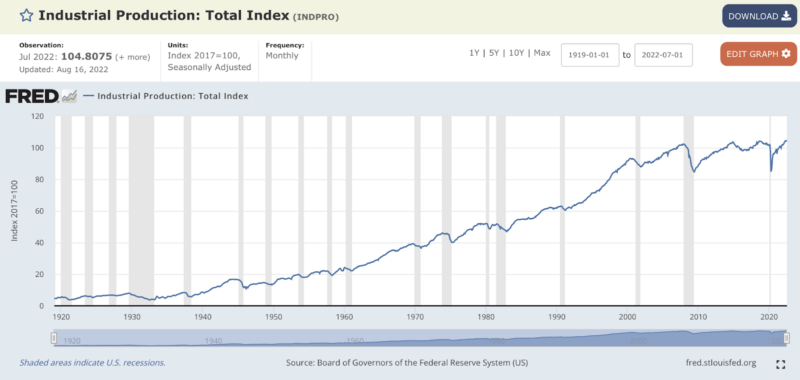
A broader measure of output is industrial production, which includes, in addition to manufacturing output, also the mining of raw materials and production of energy. Industrial production has grown steadily for more than a century. In July 2022, the latest month for which these data are available, U.S. industrial production was at an all-time high.
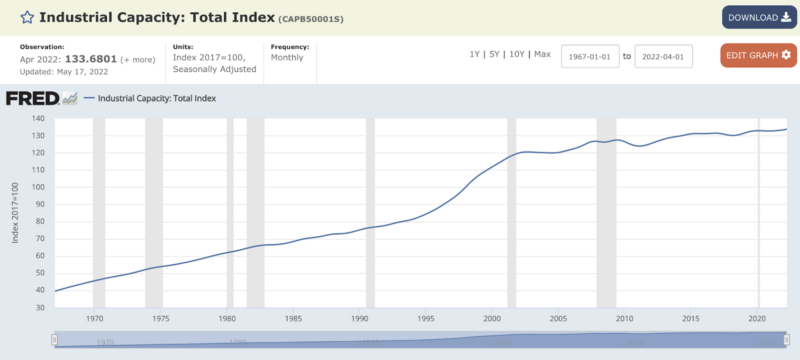
Given this reality of U.S. industrial output, it’s no surprise that, as the next graph shows, U.S. industrial capacity is also at an all-time high.