

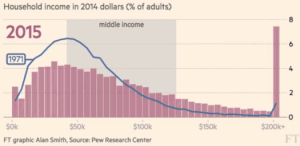
HT to Michael York for alerting me to this Money Illusion post by Scott Sumner – a post that contains this graph:
Relatedly: below it is a screen-shot of a slide in one of my PowerPoint presentations:

UPDATE: Ike Pigott, in the comments, sends along this “in motion” version of the graph from Scott Sumner’s post that I share above.

