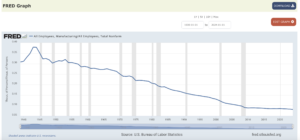

For a variety of reasons, I want to post this graph here. It is constructed by me from the St. Louis Fed’s FRED Data from two different FRED files: total number of manufacturing workers in the U.S. (“MANEMP“) and total number of nonfarm workers in the U.S. (PAYEMS). I divided the former by the latter.
The resulting graph shows – from 1939 through 2024 – the percentage of nonfarm workers in America employed in jobs classified as “manufacturing.” This percentage peaked in 1943 (at just shy of 38%) and is today (2024) at a low of 8.2%. (The latest monthly figure – December 2024 – has this rate down to 8.1%. Also, the highest monthly figure is for November 1943, at 38.8%.)