
Here’s a letter to National Review.
Editor:
Dan McLaughlin is correct that the U.S. economy is generally performing worse so far during Trump’s second term than performed during the comparable period of his first term (“Trump Lost the Voters’ Trust on the Economy Before the War,” November 6).
Consider these comparisons of economic performance from January 2025 through September 2026 with the performance during the corresponding period of Trump’s first term, January 2017 through September 2018.
Inflation, measured by the personal consumption expenditures price index, was 5.45% under Trump 2.0, compared with 2.98% under Trump 1.0.
The unemployment rate rose from 4.0% to 4.2% under Trump 2.0, while falling from 4.7% to 3.7% under Trump 1.0.
Total nonfarm employment grew by only 0.54% under Trump 2.0, compared with 2.56% under Trump 1.0.
Manufacturing employment fell by 0.09% under Trump 2.0, compared with a 3.05% rise under Trump 1.0.
Real average hourly earnings of production and nonsupervisory workers rose by only 0.50% under Trump 2.0, compared with 1.73% under Trump 1.0.
Real median weekly earnings fell by 0.80% under Trump 2.0, compared with an increase of 0.57% under Trump 1.0.
Industrial production rose by 3.88% under Trump 2.0, compared with 5.41% under Trump 1.0.
Real gross private domestic investment increased by 4.71% under Trump 2.0, compared with 10.04% under Trump 1.0.
The real stock of foreign direct investment in the U.S. increased by only 1.72% under Trump 2.0, compared with 7.28% under Trump 1.0.
Real exports of goods and services rose by 2.08% under Trump 2.0, compared with 2.85% under Trump 1.0.
Real GDP increased by 4.06% under Trump 2.0, compared with 4.53% under Trump 1.0.
Federal debt held by the public, measured as a percentage of GDP, rose under Trump 2.0 (through the second quarter of 2026) from 96.4% to 97.4%, compared with a slight decline over the corresponding period of Trump 1.0, from 75.6% to 75.2%.
Of course, the economy under Trump 2.0 didn’t perform worse in every respect. Industrial capacity, for example, rose by 2.16% under Trump 2.0 but fell by 0.79% under Trump 1.0. And real per-capita GDP grew at nearly identical rates under the two administrations: 3.57% under Trump 2.0 and 3.58% under Trump 1.0.
Nevertheless, by many relevant measures, the American economy performed worse – and often much worse – over the first half of Trump 2.0 than it performed over the first half of Trump 1.0. It’s little wonder that voters today are less impressed with Trump’s economic stewardship than they were at the corresponding point in his first term.
Sincerely,
Donald J. Boudreaux
Professor of Economics
and
Martha and Nelson Getchell Chair for the Study of Free Market Capitalism at the Mercatus Center
George Mason University
Fairfax, VA 22030Notes: (1) Comparisons use mostly monthly data, but the foreign-direct-investment figures, and federal debt figures, are based on quarterly observations. (2) Inflation figures measure cumulative increases in the price level, not annualized inflation rates. (3) Nominal figures above are adjusted for inflation using the personal-consumption-expenditure index. (4) Data for Q3 2026 federal debt as a percentage of GDP will not be released until later this month.
UPDATE:
In response to my earlier letter to National Review, a friend wrote to suggest that a better starting point for each of the two Trump administrations is three months after each inauguration day. The idea is to ensure that data from the new administration isn’t corrupted by hold-over data from the previous administration. Here’s a revised letter that takes account of this reasonable suggestion.
Don
……………
Editor, National Review
Editor:
Dan McLaughlin is correct that the U.S. economy has generally performed worse during Trump’s second term than during the comparable period of his first term (“Trump Lost the Voters’ Trust on the Economy Before the War,” November 6).
To allow each administration three months to get underway, consider these comparisons of economic performance from April 2025 through September 2026 with the performance during the corresponding period of Trump’s first term, April 2017 through September 2018.
Inflation, measured by the personal consumption expenditures price index, was 4.83% under Trump 2.0, compared with 2.70% under Trump 1.0.
The unemployment rate was 4.2% in September 2026, compared with 3.7% in September 2018.
Total nonfarm employment grew by only 0.41% under Trump 2.0, compared with 2.18% under Trump 1.0.
Manufacturing employment was unchanged under Trump 2.0, compared with growth of 2.77% under Trump 1.0.
Real average hourly earnings of production and nonsupervisory workers rose by only 0.03% under Trump 2.0, compared with 1.45% under Trump 1.0.
Real median weekly earnings fell by 1.60% under Trump 2.0, compared with no change under Trump 1.0.
Industrial production rose by 2.79% under Trump 2.0, compared with 4.08% under Trump 1.0.
Real gross private domestic investment increased by 8.07% under Trump 2.0, compared with 8.33% under Trump 1.0.
The inflation-adjusted stock of foreign direct investment in the U.S. increased by 1.15% under Trump 2.0, compared with 5.08% under Trump 1.0.
Real GDP increased by 2.0 by 3.04% under Trump 2.0, compared with 3.94% under Trump 1.0.
Real per-capita GDP rose by 2.7% under Trump 2.0 compared to a rise of 3.2% under Trump 1.0.
And federal debt held by the public as a percentage of GDP rose from 94.6% in the second quarter of 2025 to 97.4% in the second quarter of 2026, compared with an increase from approximately 73.9% to 75.2% over the corresponding quarters of Trump 1.0.
Of course, the economy under Trump 2.0 didn’t perform worse in every respect. Industrial capacity, for example, rose by 1.79% under Trump 2.0 but fell by 0.73% under Trump 1.0. Real exports of goods and services grew by 4.28% under Trump 2.0, compared with 3.12% under Trump 1.0.
Nevertheless, by most of these measures, the American economy performed better – sometimes much better – during the comparable period of Trump’s first term than during his second.
Sincerely,
Donald J. Boudreaux
Professor of Economics
and
Martha and Nelson Getchell Chair for the Study of Free Market Capitalism at the Mercatus Center
George Mason University
Fairfax, VA 22030Notes: Monthly comparisons run from April through September of the following year. Quarterly comparisons generally run from the second quarter through the third quarter of the following year. The FDI and federal-debt comparisons end in the second quarter of 2026. Real hourly earnings and FDI are adjusted using the PCE price index.
 When Americans buy clothing from Vietnam, the dollars we send overseas do not evaporate. Foreigners who receive dollars use them to buy American goods and services, to invest in American businesses and real estate, or to purchase American financial assets such as Treasury bonds. Every dollar that leaves the country to pay for imports creates a corresponding inflow of foreign demand for American exports, American assets, or American investment opportunities.
 There is a critical distinction between the legitimacy of a right and the morality of exercising that right. The government should only be concerned with questions such as the domain of rights, the proper role of violence, and the definitions of aggression and criminality. The government should not be concerned with all personal moral principles. There is a huge difference between establishing the permissibility of an action and the goodness or morality of it. The state should be concerned with the rights of men and not with the oughts of men.
 [Frank] Meyer’s position was not, of course, that individuals do not need help pursuing moral excellence. But he was convinced that attempts to use state force to make people virtuous were likely, in reality, to achieve the opposite, all while inviting tyranny by concentrating too much power in a single institution.
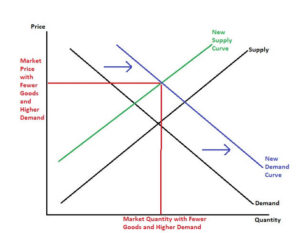 When [gasoline] prices spike sharply upward, economic illiterates everywhere are quick to see evidence of collusion or monopoly power among oil companies. In fact, big price spikes are evidence of exactly the opposite. Colluders and monopolists don’t have to wait for changes in supply and demand to hike their prices; they squeeze us to the limit all year round. Sure, changes in demand and supply give them a little more leeway, so prices still fluctuate – but only a relatively small amount.